July 16, 2014

Being a newcomer to the world of SEO, I’m finding that staring at rows of data within Google Analytics can be hard to relate back to how users actually navigate a website. In the past, I’ve opened the website I’m working on in one window while I try to decode a user’s navigation patterns in another. This method works, but it can be a pain to look back and forth between two windows to figure out what changes to make to improve a website.
Google has had an In-Page Analytics tab within Analytics itself for some time, an impressive tool that displays data in a visually impactful presentation. It allows you to step into the user’s perspective by revealing how he or she interacts with the website. While In-Page Analytics can become a go-to tool when looking for new approaches to optimize web pages, I’ve found that it can be clunky and slow. Thankfully, Google has recently developed a Chrome extension that allows you to combine the website itself with overlapping data from analytics right in your Internet browser. The plugin is extremely helpful for enhancing content and improving website layout.
The biggest advantages of the Chrome Extension are:
1. It makes In-Page Analytics easier to access and use – without the extension, the page view was very small and multiple clicks were required to get to a desired page. Now, you can interact easily with the website just like you might normally.
2. Load times - New browser updates are occurring all of the time, meaning the old In-Page Analytics would take forever to load, if they loaded at all. The extension helps eliminate this problem!
A useful aspect of the Page View plugin is that it displays a website’s pages with different colors that represent major data areas. This highlighted tool allows you to see where on a specific page users click. This is great for interpreting which parts of the page stick out and which parts are hidden to the majority of viewers. The data given can then be used to format a website for the best possible user experience, which will lead to more conversions and better search engine rankings. Page View Analytics also provides the number of users who are viewing each page and real time data from active users, as well as how much time a user spends on each page and the bounce rate, which can be extremely useful when looking for areas within the site to enhance content.

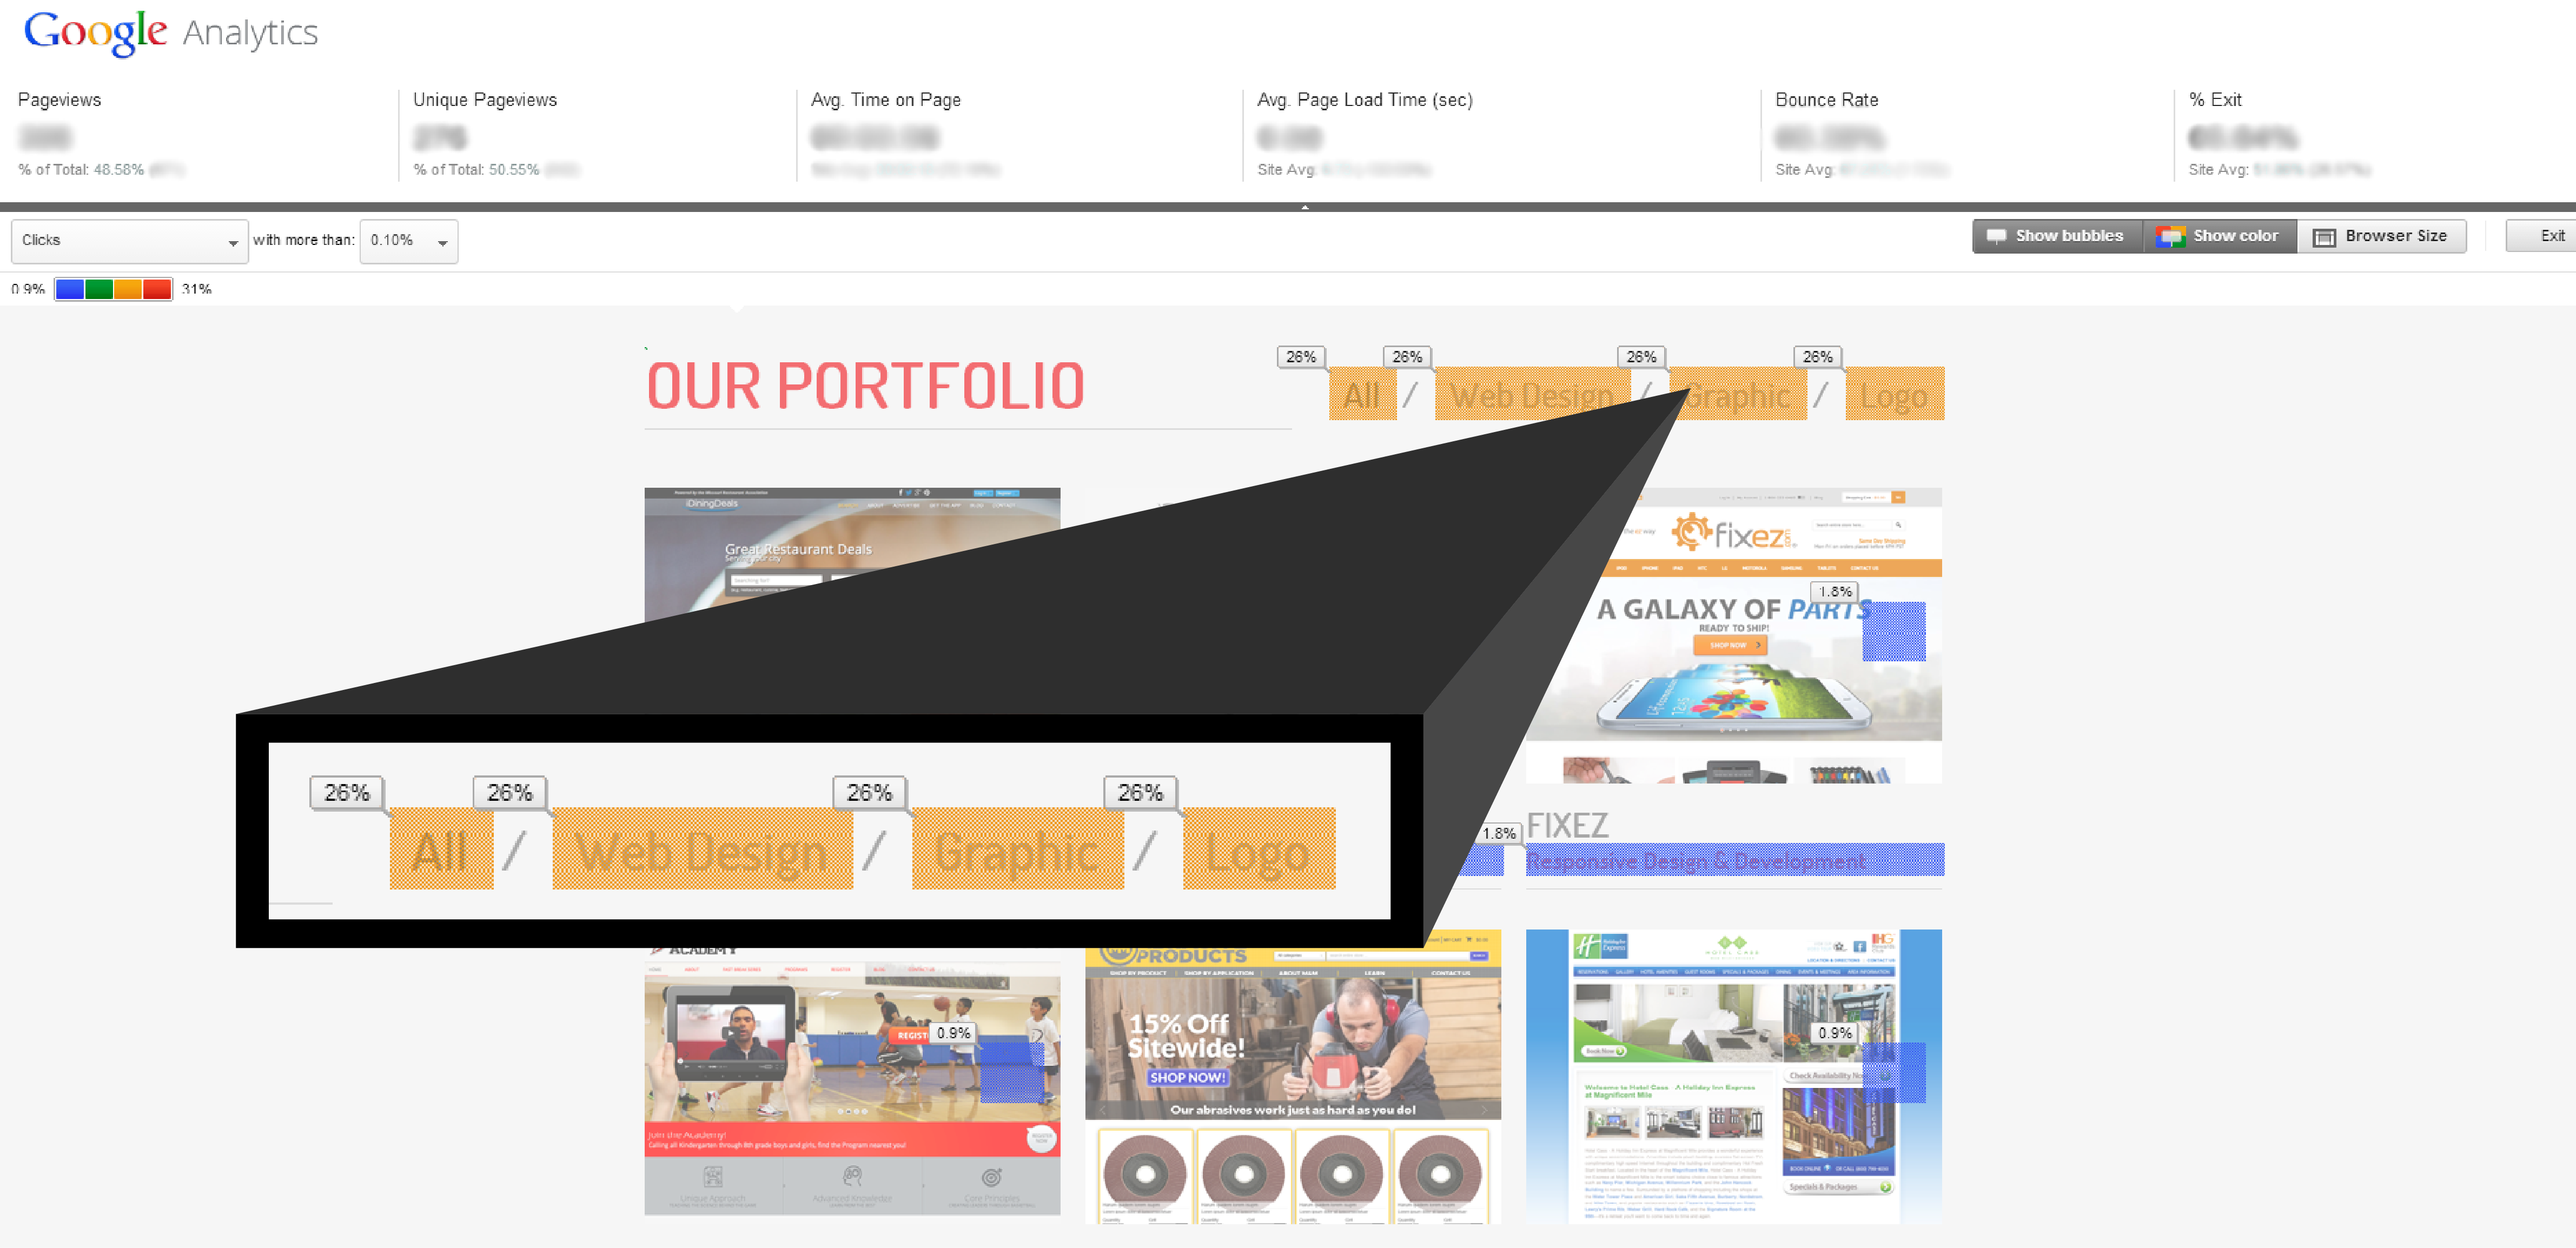
Image 1: Here's a sample of how Google Analytics Page View highlights where the users are clicking.
The yellow color and the percentage bubbles here represents the percentage of how many viewers who had visited the site clicked in that specific area/link.

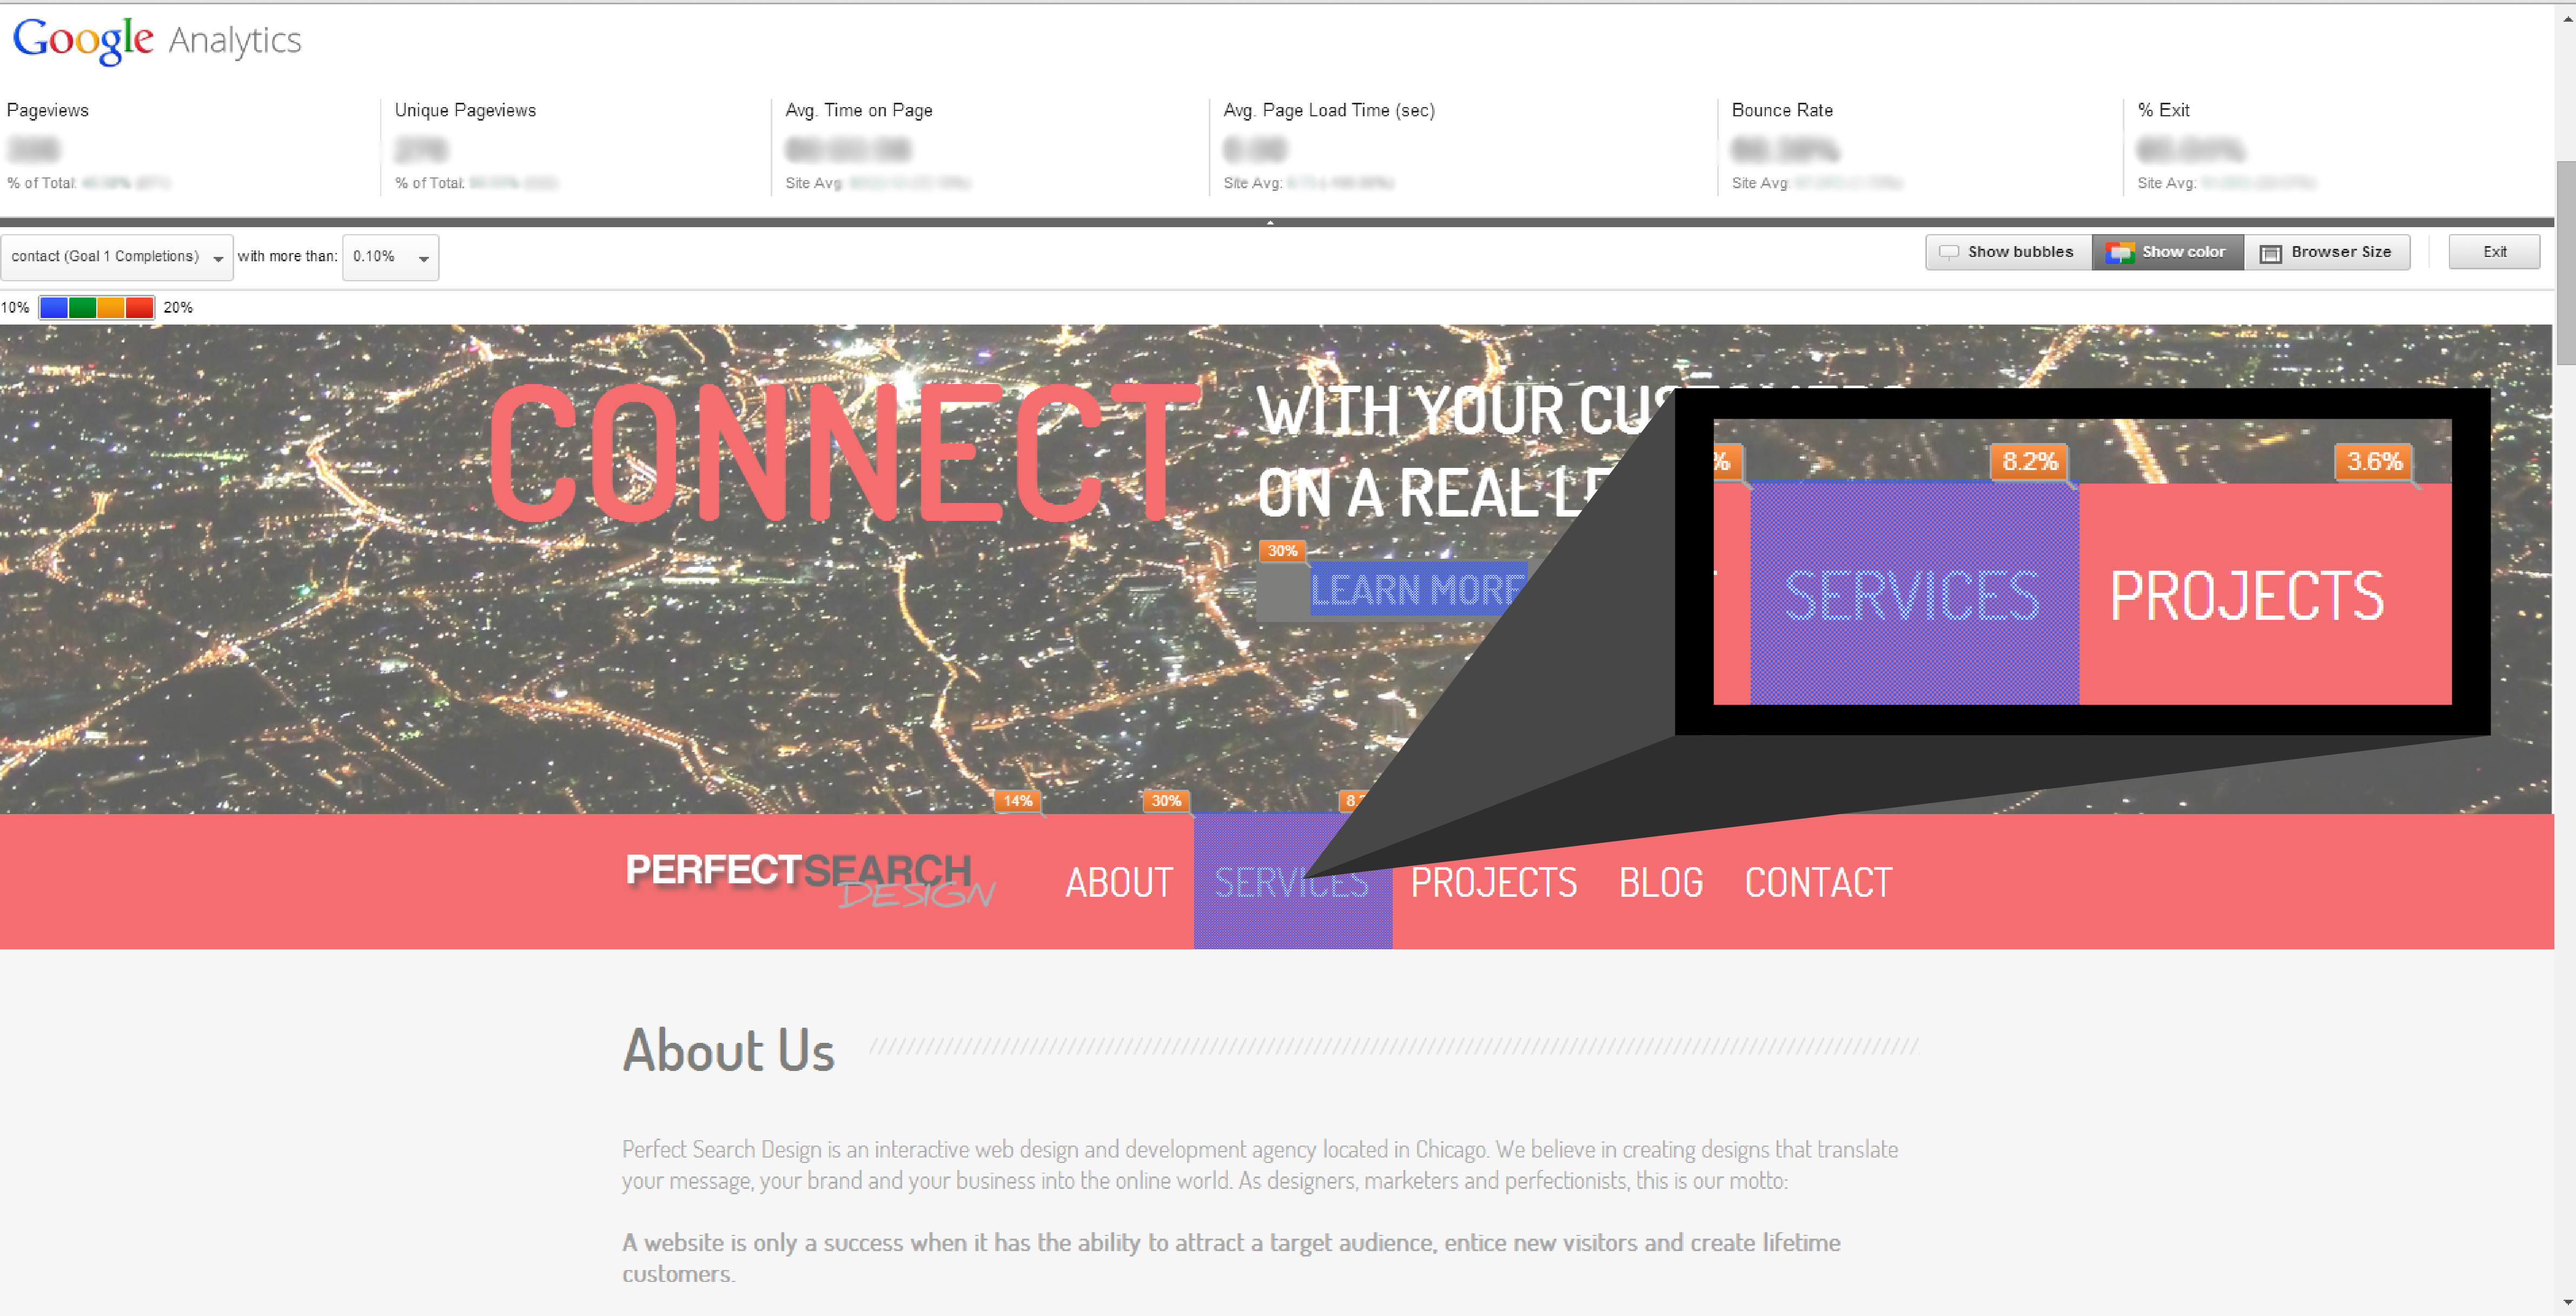
Image 2: Along with visually representing the number of clicks a webpage receives, Google Analytics Page View can also show information relating to the specific conversion goals of the website.
In this example, the percentage and 'Services' highlighted in purple represents where most of the users who filled out the contact form had clicked.
There are a few things that are required in order to use the Chrome Extension:
- Google Analytics permission to the website you want to analyze
- Google Chrome web browser
- The extension itself (download here)
Check it out for yourself, and let us know what you think at [email protected] or @Perfect_Search!
